
This post is also available in: cs
This article is part of a series about STM8 development with OpenSource tools. The full description of the toolchain is in the article STM8 Development with OpenSource Tools
Don’t be discouraged
Yes, it is a text interface, no point-and-click gadgets or fancy effects. Only
text commands.
But this interface can be very efficient and, with the help of the
cgdb tool, also beautifully colored and clear.

GDB (GNU Debugger) is the standard tool for finding bugs in software. It lets you step through a program and look at variables while it runs. For the STM8 platform we need a modified STM8-GDB from the GNU binutils package.
We will cover:
- Basics of GDB — general use of GDB: breakpoints, stepping, looking at variables. Applies to any C program.
- cgdb — a more colorful and clearer interface on top of GDB.
- Debugging with our toolchain —
make debugand viewing peripheral registers (GPIOB->ODR,TIM4->CR1, …)
The first two parts are general and independent of STM8 or our toolchain. They should serve as a small reference you can quickly skim to find commands and keyboard shortcuts, or to remind yourself how to control the program. The third part shows how to use these tools with our toolchain. The same by clicking in the VS Code or VSCodium editor, with an STM8 extension, is in the article STM8 Development with OpenSource Tools.
Tip for clickers
I recommend reading the whole article, but if you jump straight to Debugging in VS Code and VSCodium, you may be happier…
Installation
The installation of stm8-gdb is described in the article
Installing/Compiling the tools for the STM8 toolchain.
Besides GDB, you also need to have installed the Open On-Chip Debugger. This tool handles communication between GDB and the chip. GDB is therefore the tool for debugging (you enter commands here, step, look at variables), while OpenOCD handles the physical communication with the microcontroller.
Basics of GDB
This part describes the general use of GDB. To learn how to start GDB in our project and attach it to the chip, see the section Starting GDB.
GDB is a text program controlled by text commands that you type at the command line (prompt (gdb)). A few features that make your work easier:
The Tab key works in the program. This means that when you press TAB,
GDB tries to guess what you want to type and completes the words so that they make sense.
If a window with the source code is visible (by default it is not, see
Text User Interface), the focus must be on the command
window and not on the source code window, for TAB to work.
If you just press Enter — that is, you enter an empty command — the previous one is
repeated. So you do not have to keep typing e.g. next; you can type it once and then
just press Enter.
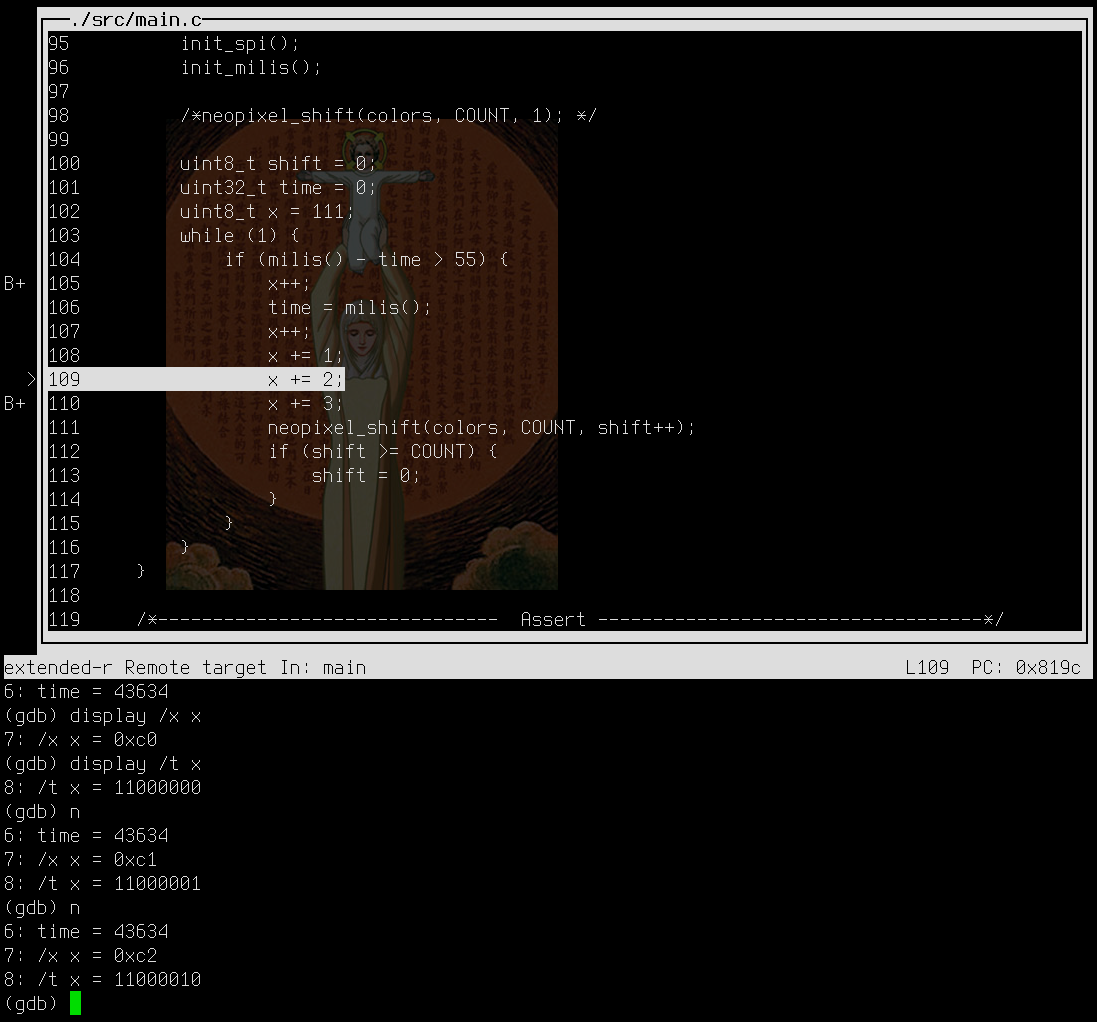
Listing source code (list)
By default GDB does not show the source code. You only see the command line.
When the program stops (at a breakpoint or after next), GDB prints only a single
line — the one that will be executed next:
1 2 | |
The surroundings of this line are shown by the list command:
list- after the program stops, prints about 10 lines around the current position; each next
list(or justEnter) continues with further lines list -- prints the lines before the ones printed last
list main,list main.c:20,list main.c:setup- prints the code around a function, a line, or a function in the given file
set listsize 20- sets the number of lines shown by the
listcommand
Text User Interface
If you want to keep the source code in view all the time, use the text interface of GDB
(TUI). The window splits: the source code with a pointer to the current line is at the
top, and the command line is at the bottom. You turn on TUI with Ctrl+X A or by starting gdb --tui (in our project make gdb). A more comfortable alternative is
cgdb.
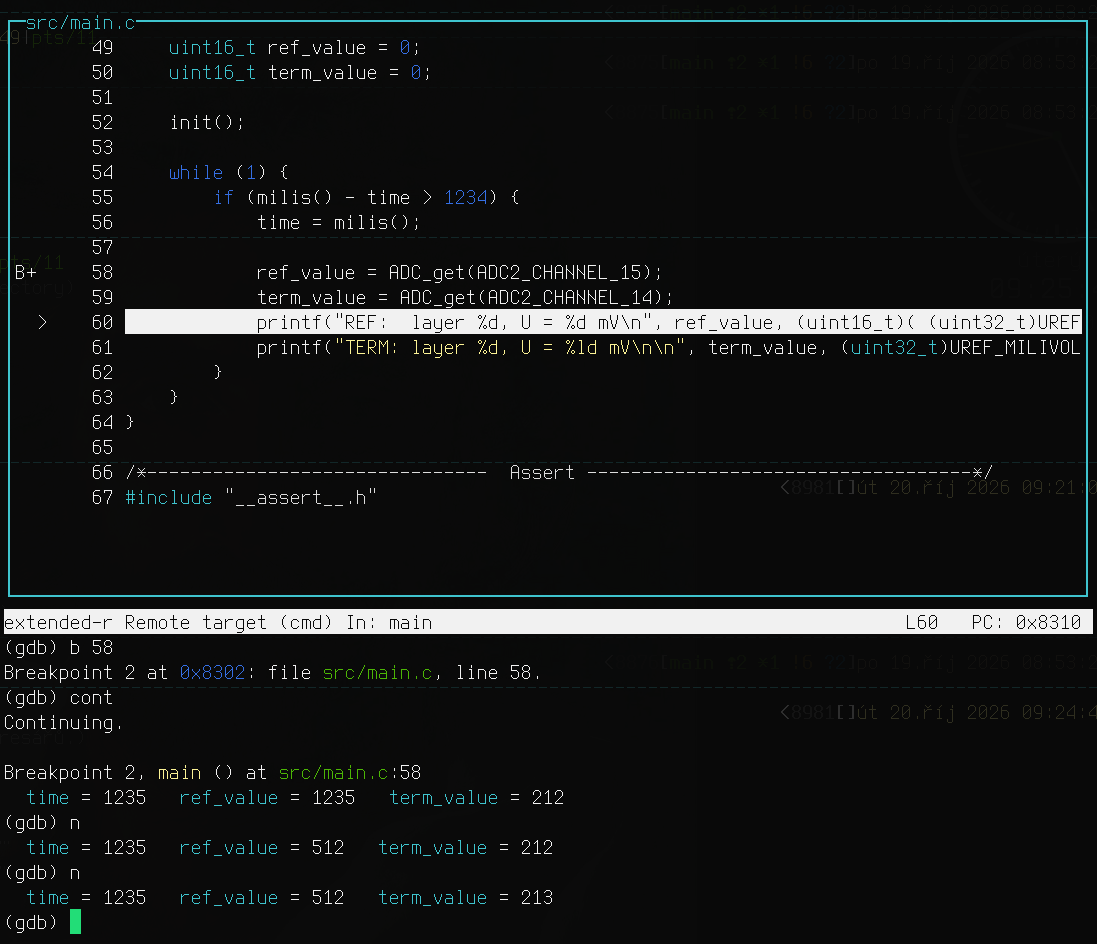
A few commands and keyboard shortcuts for TUI:
Ctrl+X A— turns TUI mode on/off (you can switch at any time)Ctrl+X 2— splits the window (split layout)Ctrl+L— redraws the screen (useful when it gets garbled)layout src— shows the source codelayout asm— shows the assemblerlayout split— shows bothlayout regs— adds the register viewfocus cmd— moves focus to the command linefocus src— moves focus to the source code windowCtrl+X O— switches focus betweensrc,cmd,asm, etc.Ctrl+X S— single-key mode:n(next),s(step),f(finish),c(continue),r(run),v(info locals),qleaves the mode
Visual markers in TUI:
>— the current position of the program (current execution point)
Breakpoint markers (combinations of hit/not-hit and enabled/disabled):
B+— breakpoint was hit and is active (enabled)B-— breakpoint was hit and is turned off (disabled)b+— breakpoint was not hit yet and is active (enabled)b-— breakpoint was not hit yet and is turned off (disabled)
Hardware breakpoints:
H+/H-— hardware breakpoint hit, enabled/disabledh+/h-— hardware breakpoint not hit, enabled/disabled
Breakpoints
A breakpoint is a place in the program — a line, a function, or an address — where the program stops as soon as it reaches it. Until the program reaches the breakpoint, it runs at full speed directly on the chip, and GDB only speaks up at the moment it stops. Then you can look at variables and registers, step through the program, or let it run on.
b main,break main- sets a breakpoint at the entry of the function
main b 48,break 48- sets a breakpoint at line 48
b milis.c:48,break milis.c:48- sets a breakpoint at line 48 in the file
milis.c info b,info breakpoints- prints information about breakpoints
d 2,delete 2- deletes breakpoint 2
disable 2,enable 2- temporarily turns breakpoint 2 off/on
Advanced breakpoints:
tbreak main- temporary breakpoint — deleted automatically after the first stop
break main.c:42 if x == 5- conditional breakpoint — stops only when the condition is true
condition 1 x > 10- adds or changes the condition of the existing breakpoint number 1
ignore 1 5- ignores breakpoint number 1 for the next 5 hits (then it becomes active again)
Controlling program execution
r,run- starts the program from the beginning (in our toolchain it also stops at
main(), see Extra commands) c,cont,continue- continues running the program until it reaches a breakpoint
s,step- executes one statement/line of the source code, enters functions
n,next- executes one statement/line of the source code, runs a function as one statement — it does not enter the function
fin,finish- finishes the function in which the program is currently located (if there is no other breakpoint in it)
interrupt,Ctrl+C- interrupts the program, which stops where it is right now
Variables and memory
p time,print time- prints the contents of the variable
time p/x time,print/x time- prints the contents of the variable in hexadecimal format
p/s string- prints a string
x/10x array- examine memory — shows 10 values in hexadecimal format starting at the address
array x/s string- examine memory as a string (useful for
char*) info locals- prints all local variables
info variables- prints all global variables
Output formats (use /format after the command):
p/d variable— decimalp/x variable— hexadecimalp/o variable— octalp/t variable— binaryp/c variable— characterp/s variable— string
Arrays and pointers:
p array- prints the whole array, if GDB knows its size (
p/x arrayin hexadecimal format) p array[2]- prints one element of the array
p array[0]@10- prints 10 elements of the array starting at index 0 (the
@operator means “that many elements starting here”) p *ptr@10- prints 10 elements starting at the address the pointer points to
p matrix[1]- for a two-dimensional array, prints one row
x/8xb array,x/4xh array- examine memory — shows 8 bytes, or 4 two-byte words (
h), in hexadecimal format starting at the addressarray; the letter after the format sets the element size:b(byte),h(2 bytes),w(4 bytes)
For an array given only as a pointer (e.g. the parameter of a function uint8_t *buf),
GDB does not know the size, so p *buf prints a single element. The number of elements
must be given with @.
GDB prints at most 200 array elements; for longer arrays the output ends with three dots.
You can change the limit with set print elements 500 (the value 0 means no limit).
An array can also be watched continuously: display/x array.
Changing the value of a variable:
You can not only read the value of a variable while debugging, but also overwrite it. This is useful, for example, to try a different value without recompiling and flashing.
set var time = 0- sets the variable
timeto 0 p time = 0- the same;
printexecutes the expression with the assignment and prints the result set var array[2] = 5,set var *ptr = 5- sets an array element, or the value the pointer points to
set {unsigned char}0x5000 = 0x20- writes a value to the given memory address (e.g. into a peripheral register)
In our toolchain this is more convenient: peripheral registers can be written by name
as in C, e.g. set var GPIOA->ODR = 0x20, see Peripheral registers.
The change applies only to the current run of the program. After run, a reset, or a new
flash, the program starts again with the original values. The word var is important
when the variable name matches some GDB command or setting.
Continuous display (display):
display time- prints the contents of the variable
timeevery time the program stops display/d time- the same as
display, but forces decimal format display/x time- shows the value in hexadecimal format at every stop
undisplay 2- display number 2 will no longer be printed when the program stops
info display- prints the list of all
displayitems
More about the print and display commands.
Finding your position
where,backtrace,bt- shows the call stack with the current position (file, function, line)
frame,info frame- shows detailed information about the current frame (including file and line)
frame 2,f 2- switches to frame number 2 in the call stack
info line- shows exact information about the current line
info sources- prints the list of source files
Running to a location (advance)
advance 56- runs the program at full speed and stops it at line 56 of the current file
advance main.c:56,advance foo,advance *0x82d4- the same for a line in another file, entry into a function, or an address
It is a shortcut for tbreak 56 followed by continue: the program runs until it reaches
the given place and stops there. The temporary breakpoint is deleted automatically after
the stop. The program also stops earlier if it hits another breakpoint or leaves the
function in which you entered advance. A similar command is until <place>, but it
requires the target to be in the same function.
next on a line with milis() looks stuck
A typical code waits for time like this:
1 2 3 4 5 | |
If the condition is not true, next does not get out of the line with if — the loop
leads back to the same line, so next steps again and again. Each step over the ST-LINK
takes tens of milliseconds, and the time from milis() barely increases while stepping
(about 1 ms per pass through the loop). Until 1234 ms pass, the steps take minutes. It is
not a bug in milis() or an interrupt, skip does not help, and every next on a
waiting loop has the same problem.
The solution is to let the program run at full speed until the condition is met:
advance 56, where 56 is the line after theif,- or
tbreak 56andcontinue.
Skipping functions (skip)
The step command enters every function that has debug information. Often this is not
wanted — for example, with library functions or functions that work with an interrupt. The skip command specifies functions (or files) which step does not enter. It executes
the function as a whole, similar to next.
skip- will skip the function in which you are currently located
skip function foo- will skip the function
foo()(skip foois the same) skip file src/foo.c- will skip all functions from the file (without an argument, the current file)
skip -gfi "*/stm8s_*.c"- will skip all files matching the glob pattern, e.g. the whole SPL library
skip -rfu "^TIM4_"- will skip functions whose name matches the regular expression
info skip- prints the list of rules including their numbers
skip disable 1,skip enable 1,skip delete 1- turns off, turns on, or deletes rule number 1 (without a number the command applies to all rules)
Good to know:
skipaffects onlystep. Thenextcommand always steps over functions.- A breakpoint inside a skipped function stops the program normally. The rule applies only when entering a function by stepping.
- Rules apply until the end of the session. Permanent rules belong in
.make/gdbinit.
Watchpoints
A watchpoint stops the program when a variable is changed or read.
STM8 limitation
OpenOCD for STM8 supports only watchpoints of length 1 byte. For larger data types (e.g. uint16_t, uint32_t) you have to watch individual bytes
(how to do it) or use conditional
breakpoints. If you try to set a watchpoint on a larger type, you get the error:
Error: Only watchpoints of length 1 are supported
watch variable- stops the program when the variable is written to (1 byte only!)
rwatch variable- stops the program when the variable is read (1 byte only!)
awatch variable- stops the program when the variable is read or written (1 byte only!)
Watching one byte of a larger variable
For a multi-byte variable (uint16_t, uint32_t, array, structure) you choose one byte,
point at it with a pointer to unsigned char, and watch what is at that address:
watch *(unsigned char *)&counter- watches the first byte (at the lowest address) of the variable
counter watch *((unsigned char *)&counter + 1)- watches the second byte;
+ 2the third, and so on watch *(unsigned char *)0x0010- watches the byte at the given address (you find the address of a variable with
p &counter) rwatch *((unsigned char *)&counter + 1),awatch *((unsigned char *)&counter + 1)- the same for reading, or for reading and writing
watch *((unsigned char *)&counter + 1) if counter > 100- the condition can use the whole variable; the program stops only when the condition is true
The byte order matters. STM8 is big-endian and SDCC stores multi-byte values the same
way: the highest byte lies at the lowest address. So for uint16_t counter = 0x1234:
| address | contents | meaning |
|---|---|---|
&counter |
0x12 |
upper byte (MSB) |
&counter + 1 |
0x34 |
lower byte (LSB) |
For uint32_t the lower byte is at &variable + 3. You can display the memory byte by
byte with x/2xb &counter. If you want to catch every change of a counter, watch the
lower byte (it changes most often). The upper byte changes only when the lower one
overflows, so it is suitable for catching rare events.
GDB stops the program only after the instruction that wrote the byte completes. A larger
variable is written in parts (e.g. a uint32_t by two ldw instructions, always two
bytes at a time), so at that moment it may be only half overwritten.
cgdb
cgdb is a curses-based interface for GDB. Working with it is a bit more pleasant and more colorful than using the TUI built into GDB. The documentation is on the project home page.
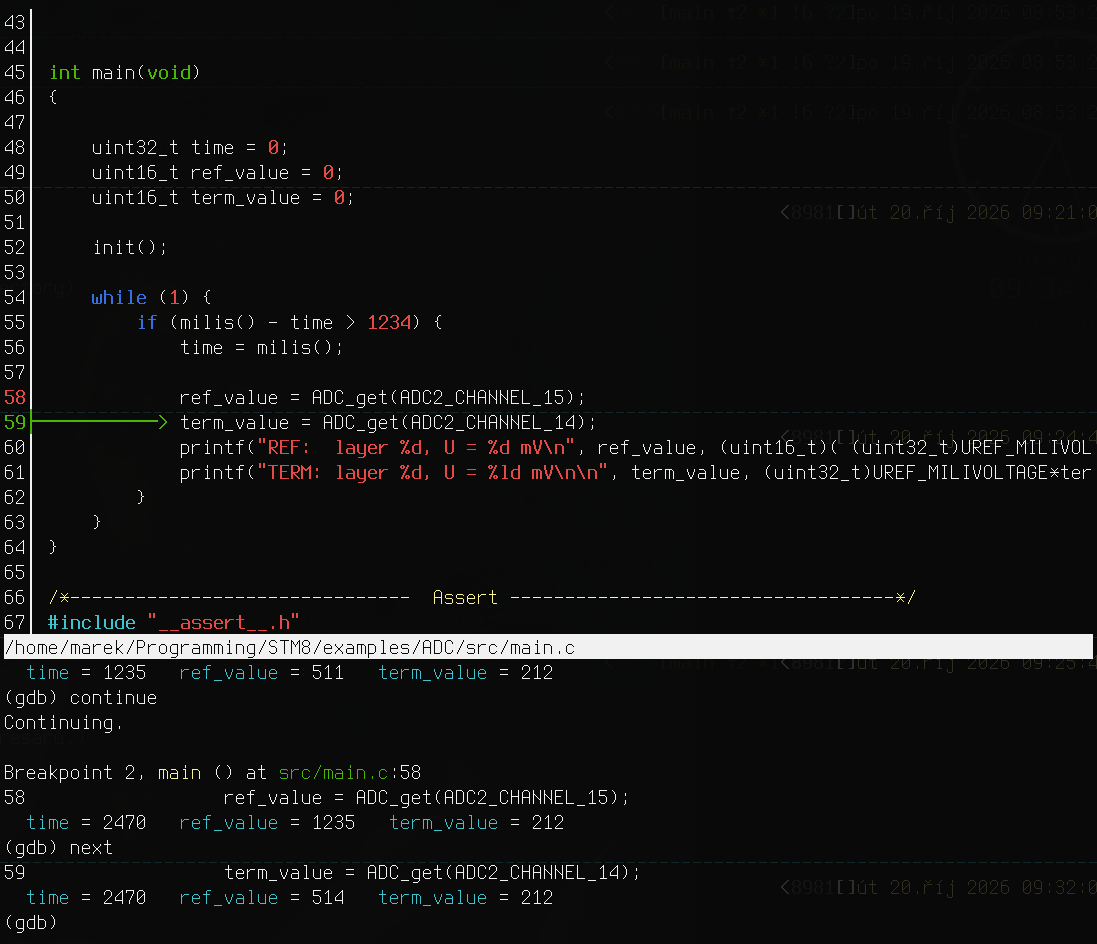
Installation
The installation is described here.
Running
cgdb is started manually roughly like this:
1 | |
In our project it is enough to call:
1 | |
(make cgdb is the same.) OpenOCD starts by itself, see Starting GDB.
Controls
cgdb is only an add-on on top of GDB — it has two windows: the lower window runs a full
GDB, so everything described in Basics of GDB applies: breakpoints, watchpoints, print, display, monitor commands and all other syntax are exactly the
same. The upper window shows the source code.
Switching between windows works like this:
Esc— moves focus to the source code window (vim-like mode)i— returns focus to the GDB command lineCtrl+W— switches the horizontal and vertical layout of the windows=/-,+/_— increases/decreases the size of the source code window (➕ ➖)
In the source code window the vim keys apply:
Space— adds/removes a breakpoint on the current linet— adds/removes a temporary breakpoint on the current linej/k, 🡇 /🡅 — move down/upCtrl+F/Ctrl+B— page down/upgg/G— jump to the start/end of the file/pattern— search,n/Njumps between resultso— opens a dialog to select a file
Function keys (in the source code window) are used to control execution. So you do not
have to use the GDB commands run, continue or next:
F5—run, inmake debugstarts again from the beginning ofmain()F6—continueF7—finishF8—nextF10—step
Debugging with our toolchain
Everything above applies to any C program. Our STM8 toolchain adds automation on top:
with one command it compiles, starts OpenOCD, flashes the program, and stops it at
main(). In addition, GDB knows the peripheral registers under the names from stm8s.h
(GPIOB->ODR, TIM4->CR1), so you can look at them and write to them as in C.
Starting GDB
Debugging starts with one command:
1 | |
It does everything necessary:
- builds the project with debug information (
make elf) and prepares the description of the peripheral registers (sfr.elf, see Peripheral registers), - starts OpenOCD — it runs only for the duration of debugging, a second terminal is not needed,
- flashes the program into the chip,
- resets the chip and stops the program at the beginning of the function
main(), - opens cgdb (if cgdb is not installed, GDB in TUI mode).
After GDB starts, it prints a block STM8 debug with the most important keys and commands. It is useful as a quick reference until you get used to it.
When you exit GDB (quit or Ctrl+D), OpenOCD ends too, and the program in the chip
starts again from the beginning.
When GDB does not connect
If it is not possible to connect to the chip, GDB prints
Nepodařilo se připojit k čipu. Je ST-Link připojený a čip napájený?
(in English: “Could not connect to the chip. Is the ST-Link connected and the chip powered?”),
followed by the last errors of OpenOCD (the full log is in build-*-elf/openocd.log).
Check the ST-LINK, the cable (SWIM, GND) and the power supply of the chip. Then start
debugging again with make debug.
Other variants:
make gdb- the same, but in GDB with TUI (Text User Interface) instead of cgdb
make cgdb- the same as
make debug make openocd- starts a standalone OpenOCD on port 3333.
make debugandmake gdbdo not need it, but when it runs, they connect to it. Useful for tools that connect to port 3333 on their own. The VS Code extension does not need it, it starts OpenOCD by itself just likemake debug.
Older versions of the toolchain
In older versions of the toolchain, you first had to start make openocd in another
terminal, and only then make gdb or make cgdb.
Extra commands
Our toolchain adds several commands to GDB:
flash- builds the project (
make elf), flashes it into the chip, and stops atmain(). If the build fails, nothing is flashed into the chip. reset,r,run,start- resets the chip and lets the program run to
main()(in cgdb this is theF5key). If the program on disk is newer than the one in the chip, it is flashed first. vars- prints the arguments and local variables of the current function. They are printed
automatically after every stop;
vars offturns this off,vars onturns it back on. Values of typeuint8_tare printed as numbers, not as characters. regs- prints the processor registers (
info registers: A, X, Y, SP, PC, CC). Peripheral registers are printed bysfr. sfr- prints peripheral registers (GPIO, timers, UART, …) with a breakdown of bits, see Peripheral registers
bm- sets a breakpoint at
main()
Commands you entered are also remembered by GDB for the next debugging session (file
~/.gdb_history_stm8). The up arrow or Ctrl+R finds them.
New code during a debugging session
You do not have to close the debugger. Edit the source file, and in another terminal (or from the editor) run:
1 | |
The program is flashed and stops at main(). The flash command does the same thing
directly in GDB.
Breakpoints and display items stay set. A breakpoint is tied to a line number, however,
so after a larger change to the source it may point somewhere else.
display remembers across sessions
The list of display items is saved, and the next make debug restores it. A display of
a local variable of a function other than main() is created when the program stops in that function.
Peripheral registers
GDB knows the peripherals from stm8s.h under the same names as in C. You can read them,
write to them, put them into display, and watch them with watch. Tab completes the names
of peripherals, registers, and bit masks.
p GPIOB->ODR- prints the output register of port B
p GPIOB- prints the whole peripheral (all its registers)
display GPIOB->ODR- prints the register after every stop (it is saved to
.debug-displaylike everydisplay) set var GPIOD->ODR |= 0x10- sets a bit in the register, as in C
p/t SPI->CR2 & SPI_CR2_SSM- bit masks from
stm8s.hwork too; the expression prints the value of the SSM bit (in binary) p TIM4_CR1_RESET_VALUE- the value of the register after reset, from
stm8s.h p TIM<Tab>,p TIM4-><Tab>,p SPI_CR2_<Tab>- completes the peripheral, its registers, or the bit masks
Instead of -> you can also write a dot: SPI->CR1 and SPI.CR1 are the same in GDB.
(In C this is not interchangeable; GDB is just more lenient.)
In C, SPI is the macro ((SPI_TypeDef *) 0x5200), a pointer to a structure, and
*SPI is the whole structure. In GDB, SPI is directly the structure placed at address
0x5200, with no pointer. The asterisk can be used only on a pointer, so p *SPI ends
with an error. You print the whole peripheral without it: p SPI in GDB corresponds to
*SPI in C.
What the output looks like: a register is printed in hexadecimal, in binary, and with
the names of the set bits. A multi-bit field has a value, for example PSC=7. What changed
since the last stop is highlighted in yellow and the original value is shown:
1 2 | |
This way you immediately see what the program changed in the registers after next or
finish. When a register did not change between two stops, the highlighting disappears.
Use display without /x
display/x and p/x bypass the register formatting: you get only the bare number,
without the bit breakdown and without the change highlighting. For registers, therefore, write display GPIOB->ODR. You always see the hex value anyway.
The sfr command
sfr- prints the list of peripherals the selected chip has, with their addresses
sfr TIM4,sfr TIM4 GPIOB- prints the registers of one or more peripherals and the set bits
sfr TIM4.CR1- prints one register bit by bit, with a description, the reset value, and a comment for each bit
help sfr- a short help
Lowercase works (sfr tim4) and Tab completes names (sfr TIM4.<Tab>).
The program must be stopped; during a run sfr fails with the error Program běží
(in English: “program is running”). Stop it with Ctrl+C.
Registers of the TIM4 timer while milis() is running:
1 2 3 4 5 6 7 8 9 | |
When a bit was cleared since the previous output, it is shown as -CEN (dimmed). For 16-bit
registers that are split into bytes (CNTRH/CNTRL), sfr also adds the whole value (CNTR=0x04d2 (1234)).
Detail of one register, here the clock divider setting:
1 2 3 4 5 6 7 | |
A read that clears flags
For some registers, reading changes the state of the peripheral: UART1->DR clears
the RXNE flag (and thus the received character), similarly SPI->DR, I2C->DR and
I2C->SR3, FLASH->IAPSR and AWU->CSR. The command sfr UART1 therefore does not
read them and prints nečteno, čtení maže příznaky (Czech output, in English: “not
read, reading clears flags”). You can print them explicitly: sfr UART1.DR. Careful: p UART1 and display UART1 (the whole peripheral) do read them.
Timers run even when the program is stopped
The processor stands still, but the peripherals do not. So TIM4->CNTR changes even
between two prints during one stop. It is not an error in the printout.
Under the hood
This section is for the curious and for the case when something does not work. For normal debugging you do not need to read it.
Configuration files
.make/gdbinit— GDB configuration (nice printout of structures, command history,set print symbol offagainst the messageInternal error: pc ... in read in CU, which GDB sometimes prints for data addresses because of the debug information from SDCC),.make/stm8gdb.py— adds extra commands to GDB,.make/stm8sfr.py— peripheral registers: thesfrcommand, bit output and highlighting of changes, see Peripheral registers,.make/sfr_gen.py— generator of the register description (see How GDB knows the registers),build-*-elf/sfr.elf,build-*-elf/sfr.json— its output. They are created bymake debugand regenerated only whenstm8s.h, the generator, or theMakefilechanges,.debug-display— the list ofdisplayitems from the previous debugging session (in the project directory). It contains one expression per line, so it can be edited by hand too..debug-session— the PID of the running GDB. Based on it,make flashdetects that debugging is running (see Flashing during debugging),build-*-elf/openocd.log— the OpenOCD log.
Color values: at the beginning of .make/stm8gdb.py there is VALUE_COLOR = "". If you
put a color code there (for example "35" for purple), GDB colors the values in print,
display, watch and info locals. p/x and display/x stay uncolored.
Starting GDB manually
You can also start GDB by hand. This is exactly what make gdb does.
1 | |
GDB started this way does not start OpenOCD by itself (the command for OpenOCD is passed to it
only by the Makefile), and it connects only to an already running make openocd. The register
descriptions are loaded only when sfr.elf with sfr.json lies next to the program (out.elf).
They are created by make debug, so it is enough to run it once. Otherwise GDB warns at startup
that the peripheral registers are not available.
Connecting and running the program
make debug takes care of connecting to the chip. Under the hood it does roughly this:
1 2 3 4 5 6 | |
target extended-remote | openocd ...— GDB starts OpenOCD itself and communicates with it through a pipe instead of the TCP port 3333. When GDB exits, OpenOCD exits too.load— flashes the program (ELF) into the memory of the chip.monitor reset halt— resets the chip and halts it.maintenance flush register-cache— GDB does not know that the reset changed the registers (mainly PC), and it would show the old position of the program. That is why its cache must be discarded.tbreak mainandcontinue— the program runs to the beginning ofmain()and stops.
How GDB knows the registers
SDCC does not put macros or peripheral types (GPIO_TypeDef, TIM4_TypeDef) into the ELF,
so GDB would not recognize GPIOB. The generator .make/sfr_gen.py therefore creates a helper program:
- it goes through
stm8s.hfor the selected chip and finds the peripherals (GPIOB,TIM4, …), - for each one it writes
__at(TIM4_BaseAddress) TIM4_TypeDef TIM4;, that is, a variable at the address of the peripheral, - it compiles this with SDCC into
sfr.elf. It contains only debug information, no code, so it does not mix with your program (andbreak mainhas one location), - next to it it saves
sfr.jsonwith the bit masks, reset values, and comments fromstm8s.h.
At startup GDB adds sfr.elf with the add-symbol-file command, defines the masks as macros (macro define SPI_CR2_SSM 0x02), and from then on it knows TIM4->CR1 and SPI_CR2_SSM.
Loading takes about 10 ms, generating sfr.elf about 0.1 s, and only after stm8s.h changes.
Nothing extra is read while stepping: a register is read from the chip only when you print it
or have it in display.
Flashing during debugging
When make debug is running, make flash only builds the program — the ST-LINK is held by the
debugger. GDB flashes the program into the chip: it watches the program file, and as soon as it
changes, it stops the running program, flashes the new one, and stops at main().
Manual control of the chip (OpenOCD)
The monitor commands are passed by GDB directly to OpenOCD.
monitor reset halt- resets the chip and halts it. But GDB does not know that the registers changed, and shows
the old position of the program. Therefore afterwards enter
maintenance flush register-cache. monitor reset run- resets the chip and starts the program. Caution: through GDB (with OpenOCD 0.12) it reports
Protocol error with Rcmdand the chip stays stopped. It is more reliable to usemonitor reset haltand thenmonitor resume. monitor resume- lets a halted chip run (GDB does not know about it — when debugging, prefer
continue) monitor halt- stops the running program
load- flashes the program into the chip manually (usually not needed,
make debugandflashdo it) target extended-remote localhost:3333- connects manually to OpenOCD started by
make openocd(usually not needed,make debugarranges the connection)